| Home | Documents | Reference | |||
 | |||
 |
Tutorial1. Input dataThe input data should be a text file containing only two columns separated by tab or space and without head line. The gzip format of the text file is also supported. There are two types of data are supported as input: 1.1 SNP association dataThe first column is SNP ID and the second column is the -log (P-value) or statistics or odds ratio. The format is as follows (SNP ID, -log (P-value)). If your input is P-value, the server will help transform it to -log (P-value) simply by ticking on '-logarithm transformation (necessary ONLY for P-value data)'. rs1000000 0.49471432586 rs10000010 0.51215487989 rs10000023 1.11367851344 rs10000030 0.35713994742 rs10000041 0.20210951694 rs1000007 0.04436034698 rs10000081 0.37110043558 rs10000092 0.40197592767 rs10000121 0.43937612545 rs1000014 0.45892023222 1.2 Gene association dataThe first column is gene HUGO symbol (http://www.genenames.org/) and the second column is the association data, e.g. -log (P-value), or statistics, or odds ratio. The format is as follows (gene symbol, maximum -log (P-value) of SNPs mapped to the gene): GDA 1.947306 SCN3A 1.6901569 SCN3B 1.5979106 RPLP2 0.5395532 BTBD1 0.87419355 BTBD2 1.6567885 BTBD3 1.7276942 RPLP1 1.4337983 ACAA2 2.0501711 TMEFF2 1.7416022 2. Options2.1 Optional flexible SNPs->genes mapping rulesMultiple SNPs->genes mapping rules can be utilized: 500 kb, 100 kb, 20 kb, or 5 kb upstream and downstream of gene, and within gene, ordered from broad to narrow but rough to accurate. Or, user can define any distance limit within 500 kb to form a mapping rule of SNPs->genes according to specific research focuses. The SNPs->genes mapping is established based on SNP and gene annotation from the Ensembl BioMart database (i-GSEA4GWAS is based on Release 56 and i-GSEA4GWAS v2 is based on Release 72, http://www.ensembl.org/biomart/martview). Only one option can be chosen per run, and it is only applicable for SNP data.  Figure 2.1 Option of SNPs->genes mapping rules.
2.2 Choose gene set database Figure 2.2 Options for gene set.
 2.2.1 KEGG and BioCarta pathwaysPathways from KEGG (http://www/genome.jp/kegg/) and BioCarta (http://www.biocarta.com).2.2.2 Curated gene ontology (GO) termsGO biological process, GO molecular function, GO cellular component gene sets are from MSigDB v4.0. Only the GO terms with the following evidence codes, IDA IPI, IMP IGI, IEP ISS, TAS, and with reasonable categories are included. The reasonable categories are defined by MSigDB as: 'GO gene sets for very broad categories, such as Biological Process, have been omitted from MSigDB. GO gene sets with fewer than 10 genes have also been omitted. Gene sets with the same members have been resolved based on the GO tree structure: if a parent term has only one child term and their gene sets have the same members, the child gene set is omitted; if the gene sets of sibling terms have the same members, the sibling gene sets are omitted'. 2.2.3 Customized gene setsAdditionally, users can upload their own gene set data. The format requirements of the gene set are: 1) a text file without head line; 2) each gene set per line and table separated; 3) first column is gene set ID, second column is gene set description (use 'na' or leave it as blank if not available), and the rest columns are gene HUGO symbols. GO0045726 GO0045726 NOX1 P61812 Q9Y5S8 TGFB2 GO0016045 GO0016045 CD1D NLRC4 NOD1 NOD2 O75594 P15813 PARG PGLYRP1 PGLYRP2 GO0048536 GO0048536 BCL3 JARID2 NFKB2 NKX3-2 P20749 P31314 P78367 GO0010460 GO0010460 ADRA1A ADRA1B ADRB1 B1N7G2 B1N7G7 CHRNA7 CHRNA7-2 GO0035090 GO0035090 A0PJG1 A7MBM7 ANK1 LLGL1 P16157 Q15334 GO0050982 GO0050982 A2A3D9 A9Z1W1 GRIN2B MKKS MYC O15273 P01106 P48431 P55011 P98161 P98161-2 GO0007346 GO0007346 A6NDV4 AFAP1L2 APBB1 APBB2 ATM BCL6 BLM BRCA2 GO0001890 GO0001890 AKT1 ANG ARNT BIRC2 CDX2 CDX4 CEBPB CITED1 GO0016189 GO0016189 EEA1 Q15075 GO0008406 GO0008406 A6NKD2 ACVR2A AMH ANKRD7 AR BAX BRCA2 CSDE1 DMRT1 DMRT2 2.2.4 Filter gene sets by set sizeThe size of gene sets can be restrained to avoid the overly narrow or overly broad functional categories. The default minimum and maximum gene number in gene sets are 20 and 200, respectively (Wang et al., 2007 Am J Hum Genet 81(6) 1278-1283; Fellay et al., 2009 PLoS Genet 5(12) e1000791). 2.2.5 Advanced options for gene set database
MHC/xMHC region masking for gene sets
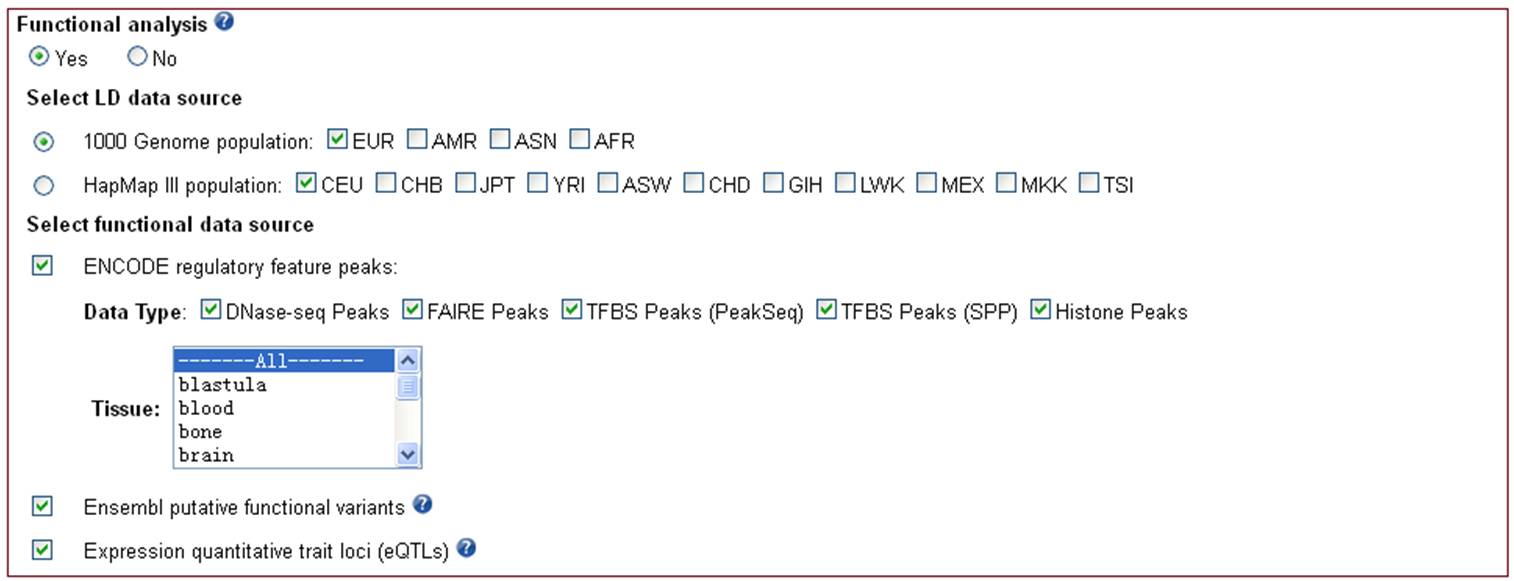
Limit gene sets by keyword  Figure 2.2.1 Advanced options for gene set database. 2.3 Options for SNP functional analysisTo facilitate to select the putative functional SNPs as causal candidates for further validation study, i-GSEA4GWAS v2 implemented functional analysis for significant SNPs in trait-associated pathway. This function is only applicable for SNP data. User can select to use 1000 Genome populations or HapMap III populations as LD data source to extract the LD-proxies for significant SNPs. In addition, user can select interested functional data sources and further filter the ENCODE regulatory feature peaks by using feature type and tissue.  Figure 2.4 Options for functional analysis.
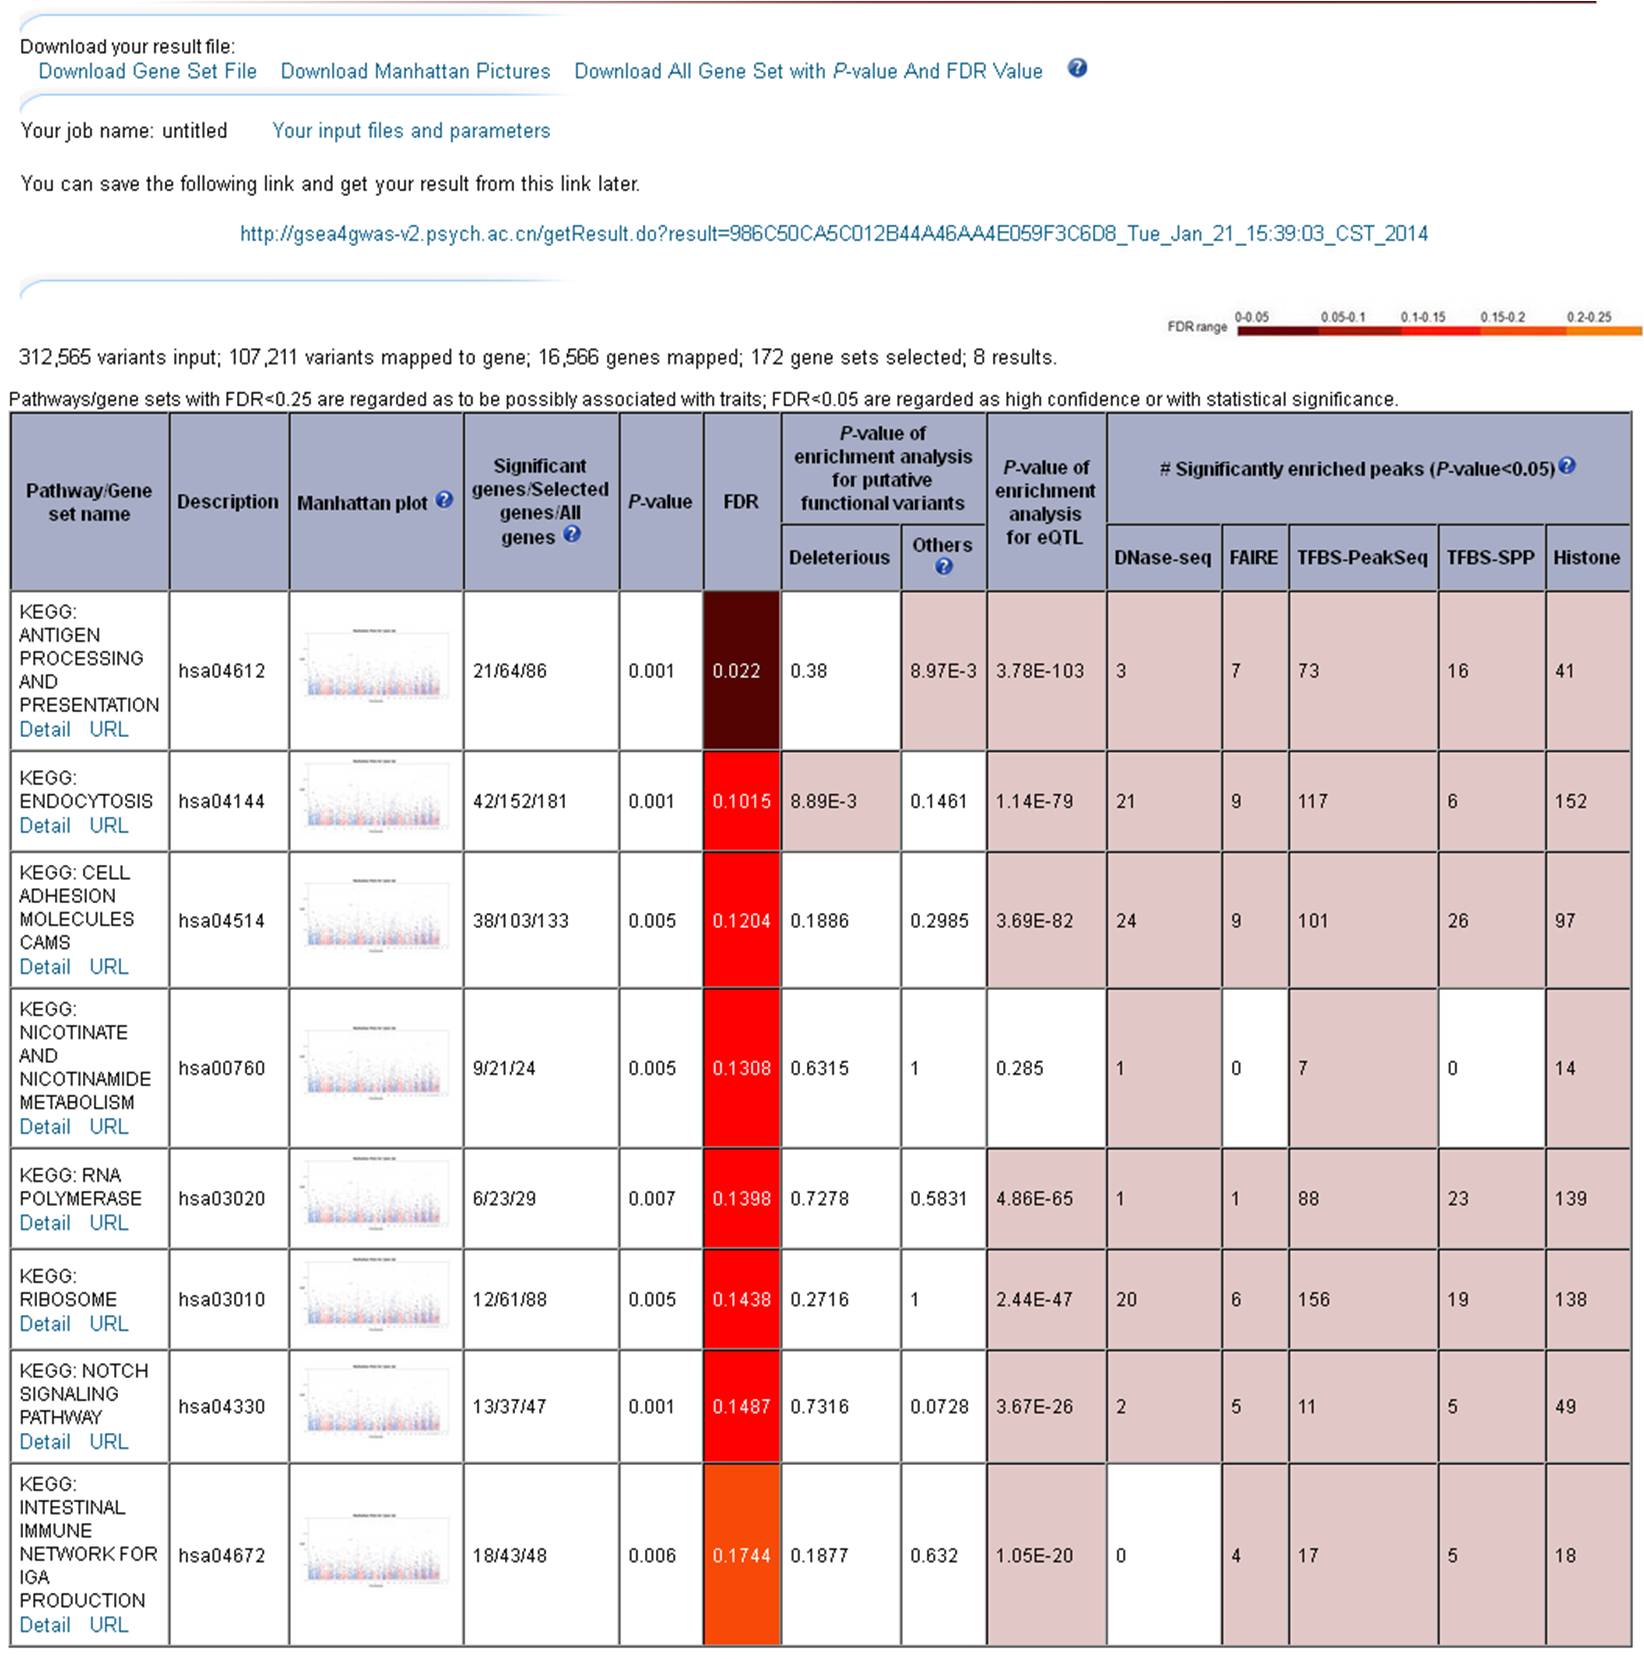
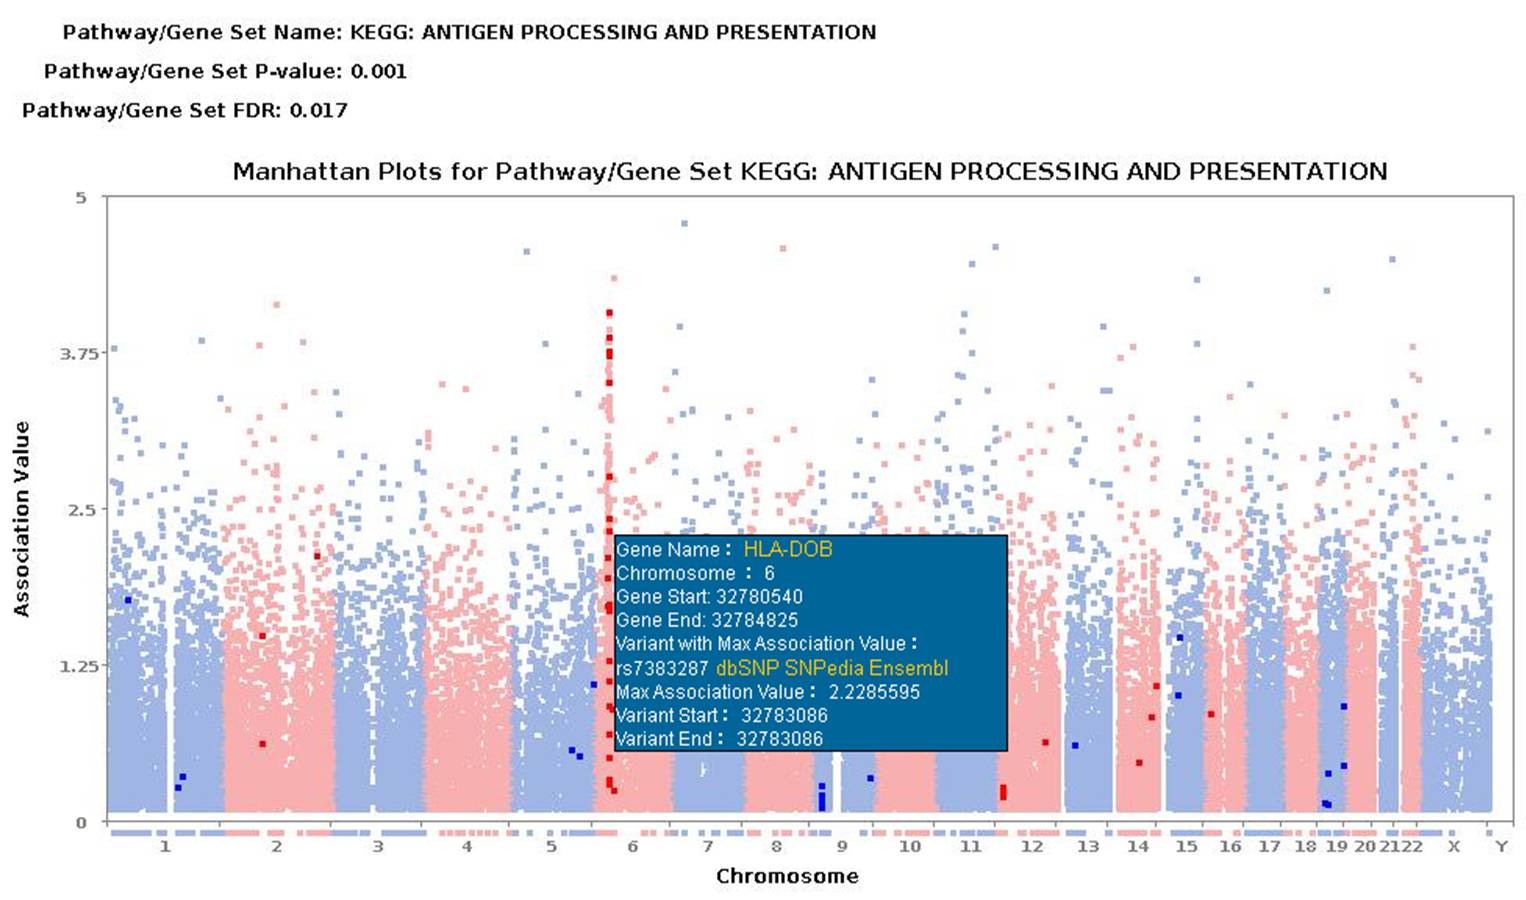
3. Output and display ( example for schizophrenia )The output interface contains the download link, from where all the results, both text and figures, can be downloaded, and a summary table in which the pathways/gene sets with FDR < 0.25 are presented and ordered by the increase of FDR (the threshold of FDR < 0.25 denotes the confidence of 'possible' or 'hypothesis', while the threshold of FDR < 0.05 is regarded as 'high confidence' or 'with statistical significance'). For each pathway, P-value of enrichment analysis for deleterious, other putative functions and eQTLs, and number of significantly enriched peaks (DNase-seq / FAIRE / TFBS-PeakSeq / TFBS-SPP / Histone) with P-value < 0.05 were shown. You can visit http://gsea4gwas-v2.psych.ac.cn/getResult.do?result=3139D6272F276C55E545CA888C582A1A_Wed_Apr_16_10:26:19_CST_2014 to see an example result. In addition, the full list of nominal P-values and FDR values of all pathways are available in result page and can be downloaded.  Figure 3 The result page. 3.1 Manhattan plot of pathway/gene setA Manhattan plot is a type of bar graph, usually used to display data with a large number of data-points - many of non-zero amplitude, and with a distribution of higher-magnitude values, for instance in genome-wide association studies (http://en.wikipedia.org/wiki/Manhattan_plot). For the Manhattan plot of GWAS, the bar of x-axis is for each chromosome and the y-axis is for association data (typically -log (P-value)). Manhattan plot of GWAS maps the result of association test to chromosomal locations. Here the Manhattan plot of gene set uses the Manhattan plot of GWAS as background, and highlights the results of association test for a given pathway/gene set. It helps users to graphically compare the association test results of the given pathway/gene set to the genome-scale data, and provides an interplay panel for user to view the information of the interesting genes belonging to the pathway/gene set.  Figure 3.1 Gene set Manhattan plot. 3.2 The number of Significant genes/Selected genes/All genes
Significant genes: genes mapped with at least one of the top 5% of all SNPs.
These numbers help users to have a clear overview of the pathways/gene sets concerning: how many genes are involved in this pathway/gene set, how many genes are included in i-GSEA analysis, and how many genes are significant.
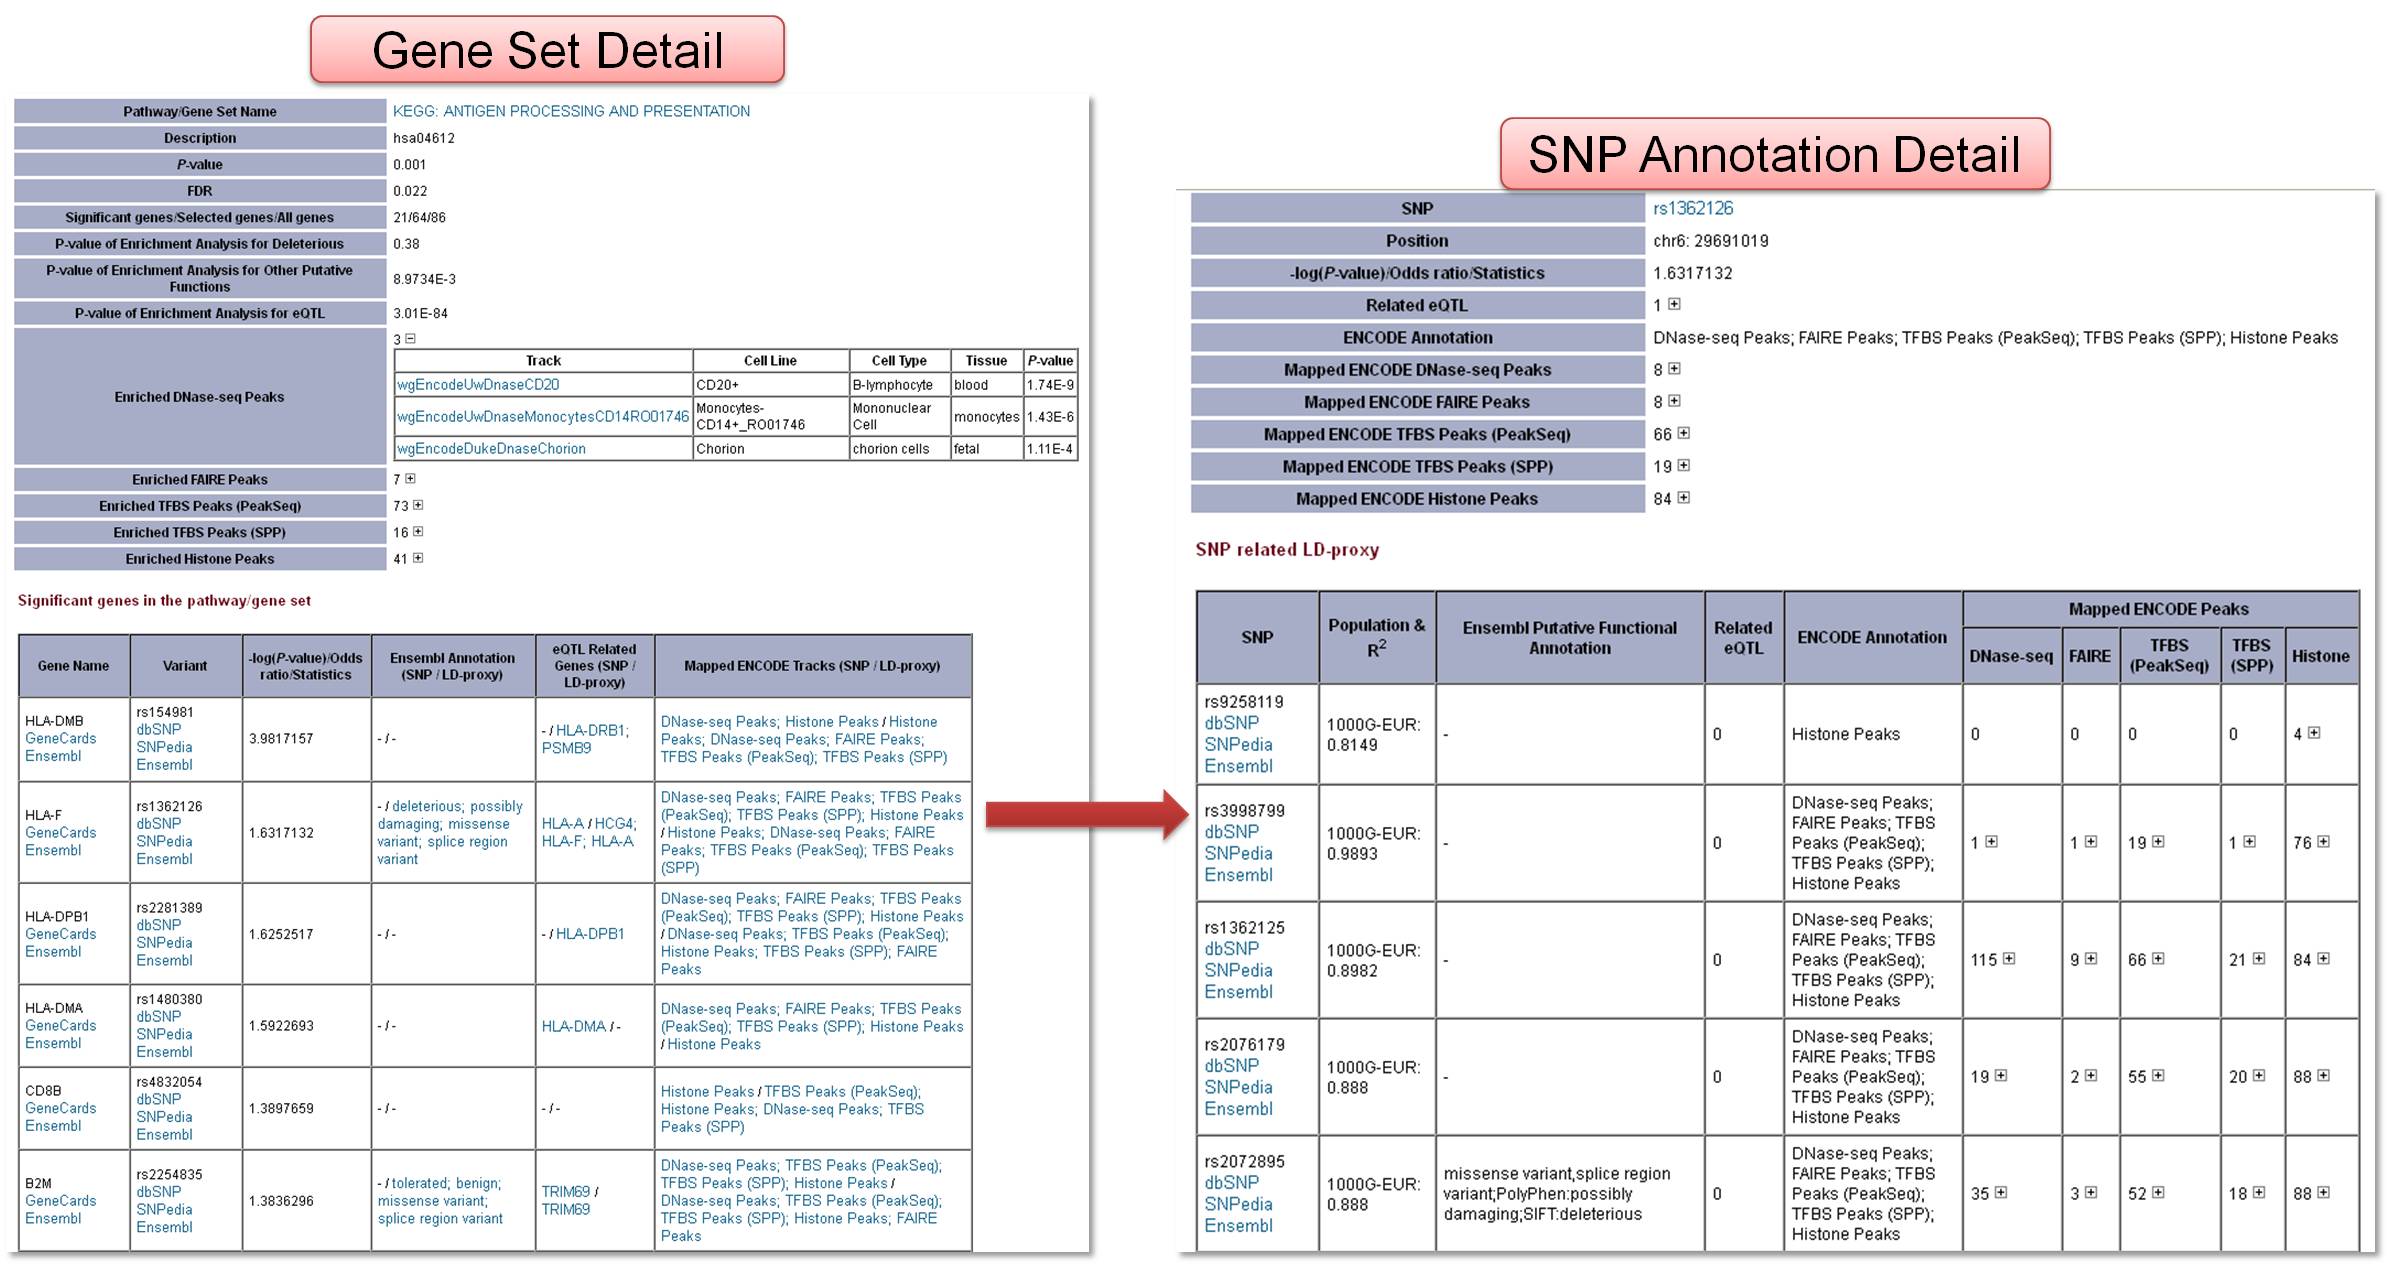
3.3 Detail page for gene set and SNP annotationFrom the result page, user can link to the detail page of gene set, in which the enriched ENCODE tracks, list of significant SNPs and related functional elements annotation were shown. Furthermore, from the link for the functional elements annotation, user can enter the SNP annotation page. List of LD-proxies for the SNP and related functional elements annotation were shown.  Figure 3.2 Gene set detail page and SNP annotation detail page. |
|
Copyright: Bioinformatics Lab, Institute of Psychology, Chinese Academy of Sciences
Feedback Last update: April 18, 2014 |